
Game Price Comparison Report 2026
Average price gap for matching variants: 40.8%
Sample: 869 matching game contexts across 9 stores.
Data as of 5 November 2026 · sample: 869 games · 3,748 price points · 9 stores Download the data (CSV, CC BY 4.0)
Sample of up to 1,000 published paid base games ordered by Steam review count, then game ID. One default platform, edition and seller region per game; native EUR only. Compare the cheapest eligible offer per distinct active store within that exact context. Missing context dimensions are excluded. No price-ratio trimming or currency conversion. Percentage gap is (highest - lowest) / highest. Every store tied at the minimum receives one win for that game context; shares divide wins by all compared game contexts and may sum above 100%. Official-store comparisons include every store classified as official, not just Steam.
Official stores and keyshops
In 393 matching contexts, an official store tied or beat the cheapest keyshop in 13% of cases. The median difference relative to the official price was 37%.
Which store is cheapest?
Share of 869 compared game contexts where each store tied for the lowest observed price. Every tied store counts, so shares can total more than 100%.
How big is the gap?
Price spread between the cheapest and priciest store, per game.
Largest observed gaps in this sample
Each example compares one matching variant. Open it to check current availability.

Sniper Elite 3
PC · Standard · Global · EUR
Winning offer observed: 2026-11-05
€99.99 €2.43
Save €97.56 (98%) · 4 stores

Geometry Dash
PC · Standard · Global · EUR
Winning offer observed: 2026-11-05
€99.00 €4.24
Save €94.76 (96%) · 3 stores
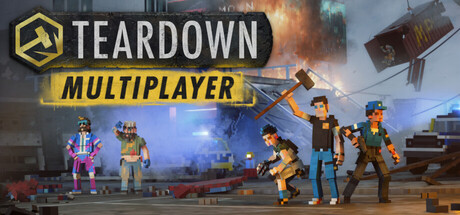
Teardown
PC · Standard · Global · EUR
Winning offer observed: 2026-11-04
€101.27 €16.43
Save €84.84 (84%) · 4 stores

Sid Meier’s Civilization VI Anthology
PC · Standard · Global · EUR
Winning offer observed: 2026-11-04
€98.70 €22.57
Save €76.13 (77%) · 6 stores
The Quarry
PC · Standard · Global · EUR
Winning offer observed: 2026-11-04
€64.57 €4.29
Save €60.28 (93%) · 5 stores

Demonologist
PC · Standard · Global · EUR
Winning offer observed: 2026-11-04
€77.01 €17.55
Save €59.46 (77%) · 4 stores
Compare any game in seconds
Compare observed offers for a selected platform, edition and seller region.
Methodology
Sample of up to 1,000 published paid base games ordered by Steam review count, then game ID. One default platform, edition and seller region per game; native EUR only. Compare the cheapest eligible offer per distinct active store within that exact context. Missing context dimensions are excluded. No price-ratio trimming or currency conversion. Percentage gap is (highest - lowest) / highest. Every store tied at the minimum receives one win for that game context; shares divide wins by all compared game contexts and may sum above 100%. Official-store comparisons include every store classified as official, not just Steam.
Report calculated: 2026-11-05. Seller-feed observations in this sample: 2026-11-01T04:05:01.899Z - 2026-11-05T17:57:54.079Z.
Frequently asked questions
What does the average gap compare?▾
Within this sample, matching platform, edition and seller-region offers differ by an average of 40.8% of the higher price.
Does this measure the entire catalog?▾
Sample of up to 1,000 published paid base games ordered by Steam review count, then game ID. One default platform, edition and seller region per game; native EUR only. Compare the cheapest eligible offer per distinct active store within that exact context. Missing context dimensions are excluded. No price-ratio trimming or currency conversion. Percentage gap is (highest - lowest) / highest. Every store tied at the minimum receives one win for that game context; shares divide wins by all compared game contexts and may sum above 100%. Official-store comparisons include every store classified as official, not just Steam.
Are these live checkout prices?▾
These are seller-feed observations. The report calculation date is separate from each winning offer observation; check the seller before purchase.